The PDF version of the letter has all tables and footnotes:
KEI-NIH-28Aug2028
August 28, 2024
Abby Rives, JD
Division Director
Technology Transfer and Innovation Policy
National Institutes for Health
Vladimir Knezevic, MD
Senior Advisor for Commercial Evaluation
Technology Advancement Office
National Institutes for Health
Dear Abby Rives and Dr. Knezevic,
I am writing to express our concern that the National Institutes of Health (NIH) licensing policy frequently favors a worldwide monopoly on NIH-owned inventions, despite ample evidence that such monopolies are associated with morally repugnant disparities in access, and that the extension of the monopoly to lower income countries provides little, if any, consequential incentives for the commercialization of inventions.
In the past, we have raised this issue in the context of Chapter 300 of the Public Health Service (PHS) Licensing Policy, which states “PHS seeks to promote commercial development of inventions in a way that provides broad accessibility for developing countries,”[1] and of 35 U.S.C. § 209, which requires federal agencies to limit the scope of rights to those which are “reasonably necessary to provide the incentive for bringing the invention to practical application.”
In an email to KEI on April 19, 2024, Dr. Knezevic stated that “NIH does not currently report on developing country utilization of technologies licensed from the NIH.”
I have personally been involved in efforts to expand access to NIH-funded inventions for more than three decades and I found this statement both credible and appalling. In literally hundreds of communications with the NIH leadership and technology personnel, we have raised concerns over the unequal access to federally funded biomedical inventions, which reflects profound policy failures.
Dr. Knezevic’s earlier emails echo a common view that the NIH can rely upon assertions by potential licensees that global exclusivity is essential to achieve the practical application of inventions. I’m an economist by training and fully appreciate that the companies seeking licenses benefit from the broadest geographic scope of exclusive rights, but also that the NIH is obliged to do more than rubber stamp industry assertions that global rights are actually necessary. It’s not enough to argue that global rights are a qualitatively positive incentive. The NIH needs to determine if global rights are quantitatively necessary, given the obvious negative impact on access and equity that are often the consequence of monopoly control of medical technologies.
As a matter of policy making, it is shocking that the NIH, a public health agency tasked with funding innovation to address global health problems, does not systematically collect data on where its inventions are used.
In 2019 the World Health Assembly (WHA) adopted a landmark resolution: WHA72.8 – Improving the transparency of markets for medicines, vaccines, and other health products.[2] The norms set out in the resolution were adopted despite opposition from the pharmaceutical industry, and the failure of Germany, Hungary, and the UK to join the consensus. The U.S. government was among the most vocal supporters of the resolution. Among the provisions are the following:
———————————————————————————–
WHA72.8. Page 2
Agreeing that policies that influence the pricing of health products and that reduce barriers to access can be better formulated and evaluated when there are reliable, comparable, transparent and sufficiently detailed data/1/ across the value chain,
1. URGES Member States in accordance with their national and regional legal frameworks and contexts:
(1) to take appropriate measures to publicly share information on the net prices/2/ of health products;
(2) to take the necessary steps, as appropriate, to support dissemination and enhanced availability of, and access to, aggregated results data and, if already publicly available or voluntarily provided, costs from human subject clinical trials regardless of outcomes or whether the results will support an application for marketing approval, while ensuring patient confidentiality;
(3) to work collaboratively to improve the reporting of information by suppliers on registered health products, such as reports on sales revenues, prices, units sold, marketing costs, and subsidies and incentives;
/1/ Including but not limited to data on: availability, especially in small markets; units sold and patients reached in different markets; and the medical benefits and added therapeutic value of these products.
/2/ For the purposes of this resolution, “net price,” “effective price,” “net transaction price” or “manufacturer selling price” are the amount received by manufacturers after subtraction of all rebates, discounts, and other incentives.
https://www.who.int/publications/m/item/wha72.8
———————————————————————————–
World Health Organization (WHO) members agreed to improve the availability of (1) reliable, (2) comparable, (3) transparent, and (4) sufficiently detailed data across the value chain, including the prices, units sold, costs, and subsidies and incentives.
The NIH is not in compliance with these norms. At least as regards the issue of transparency, some of the challenges relate to the provisions in the Bayh-Dole Act concerning the confidentiality of reports on the utilization of inventions. While the original 1980 version of the Bayh-Dole Act gave federal agencies considerable discretion in determining what information should be reported or confidential, subsequent amendments have progressively limited the information the funding agency can require or disclose to the public. The key statutory provision on the reporting of the utilization of federally owned licensed inventions is 35 U.S.C. § 209(d)(2), which states that a license shall include the provisions:
(2) requiring periodic reporting on utilization of the invention, and utilization efforts, by the licensee, but only to the extent necessary to enable the Federal agency to determine whether the terms of the license are being complied with, except that any such report shall be treated by the Federal agency as commercial and financial information obtained from a person and privileged and confidential and not subject to disclosure under section 552 of title 5;[3]
To obtain the type of information described in WHA72.8, the license has to require terms including reports on “the prices, units sold, costs and subsidies and incentives,” and that the prices and units sold are reported “in different markets.” The resolution also requires that the information be “reliable, comparable,” and “sufficiently detailed.”
The fact that the NIH apparently does not know where licensed products are sold, or at what prices, makes it unnecessarily difficult to assess the extent to which federally-funded inventions are developed “in a way that provides broad accessibility for developing countries.”
Reports on the units sold in different markets are essential for monitoring the achievement of the often-expressed objective of promoting more equitable access, and it is particularly important that this information is available for publicly-funded medical inventions, where governments have the legal rights to influence outcomes as regards access.
The NIH often claims that a global monopoly is a necessary incentive to induce investments to develop and commercialize inventions, typically based upon bald assertions by companies seeking licenses to NIH-owned technology. Such assertions are not credible in cases where company revenues from a product are small or non-existent in developing country markets, particularly for countries with low incomes.
The NIH should routinely collect and analyze data on where products are sold and the prices and revenues generated, disaggregated by country, and in some cases, when possible, markets within countries, such as sales to government entities. And since the collection of data from licensees is limited to “the extent necessary to enable the Federal agency to determine whether the terms of the license are being complied with,” the license should include a clause that enables the agency to require the licensee to provide the relevant information. To be consistent with the WHA72.8 norms, this should include national (or subnational markets in some cases) prices, revenues and units sold, as well as the costs of each clinical trial, and relevant subsidies and incentives such as, but not limited to, the granting of priority review vouchers, R&D or Orphan Drug tax credits, or grants from the NIH, BARDA, DOD or other governmental agencies worldwide.
For a number of drugs, vaccines, or cell or gene therapies, companies earn very little from developing country markets, and in many cases, no revenue at all from countries with lower incomes, including the many countries where companies do not even offer products for sale.
Even when there are non-zero sales in a country, access may be so restrictive that the amount of sales revenue is negligible.
By requiring the reporting of the costs of clinical trials and the revenues and units sold by national market, the NIH will have information most relevant to evaluating the consistency with the PHS policy objective of promoting access in developing countries, and the scope of rights actually necessary to achieve practical application of inventions.[4]
The NIH should consider policies that more directly achieve the PHS policy objective of increasing access in developing countries. KEI has recommended that the NIH avoid the use of exclusive licenses in markets where the per-capita income of countries is less than 30 percent of the United States,[5] as well as other measures, such as requiring companies to license to the Medicines Patent Pool or the WHO Health Technology Access Pool, to register products in developing countries, or to provide technology transfer.[6]
In the past, for some licenses, the NIH has indicated that the geographic patent landscape was not extensive in developing countries, and implied that this satisfied the PHS policy of promoting “broad accessibility for developing countries.” However, this is often not sufficient, and the NIH should both know and acknowledge this is the case. When the NIH licenses technology, it has leverage, and in some cases enormous leverage to address access concerns. There should be a standard clause in licenses that allows the NIH to mandate deep technology transfer[7] to firms that can serve markets where the licensed entity is unable or unwilling to provide broad access to products.
An attached Annex provides public data on geographic sales revenues from IQVIA and five company investor reports. This Annex illustrates both the enormous disparities in access to products and also the small quantitative impact on incentives if the NIH takes concrete steps to limit the geographic scope of monopolies for products in developing country markets.
KEI requests a meeting with the NIH to discuss these issues further.
Sincerely,
James Packard Love
Director
Knowledge Ecology International
james.love@keionline.org
+1.202.361.3040
https://keionline.org
ANNEX: Selected Public Data on Geographic Segments
IQVIA Data
Detailed data on units sold or revenue by country is available for sale by IQVIA but at a high cost and subject to non-disclosure agreements. IQVIA does occasionally publish some sales revenue by geographic regions but it is typically highly aggregated.
Several IQVIA reports use three broad geographic market segments: developed markets, “pharmerging” markets and lower-income countries. This is how IQVIA defines each group:[8]
- DEVELOPED MARKETS are defined by IQVIA based on the World Bank’s income definitions and include high and upper-lower-income countries, with the exception of pharmerging markets. Within the developed markets are a subset focusing on the 10 largest countries with high incomes and with pharmaceutical spending greater than $10Bn. These countries are Australia, Canada, France, Germany, Italy, Japan, South Korea, Spain, the UK, and the U.S.
- PHARMERGING MARKETS are defined as countries with per capita GDP <$30,000/year and forecasted 5-year aggregate pharma sales growth >$1Bn (absolute or rounded) in at least two forecasts. These countries are Argentina, Bangladesh, Brazil, Chile, China, Colombia, Egypt, Hungary, India, Indonesia, Mexico, Pakistan, Philippines, Poland, Romania, Russia, Saudi Arabia, South Africa, Taiwan, Turkey, Ukraine, and Vietnam.
- LOWER-INCOME COUNTRIES includes lower-middle and low-income countries using the World Bank’s bands, with the exception of Pharmerging markets.
- WORLD BANK INCOME BANDS such as high, upper middle, lower middle, and low are based on World Bank methodologies. For current World Bank classifications, see: https://datahelpdesk.worldbank.org/knowledgebase/articles/906519
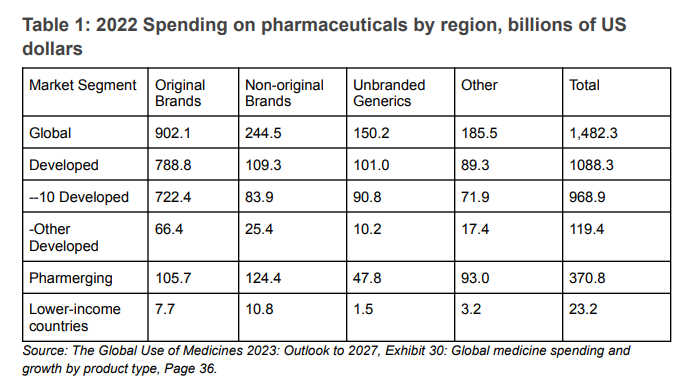
According to IQVIA, the 2022 sales of “original brands” medicines were $902.1 billion, of which $722.4 billion, or 80 percent, represented sales in 10 developed countries. Sales in countries IQVIA designated as “lower-income countries” were $7.4 billion, or 4.4 percent of all sales.
Table 1: 2022 Spending on pharmaceuticals by region, billions of US dollars
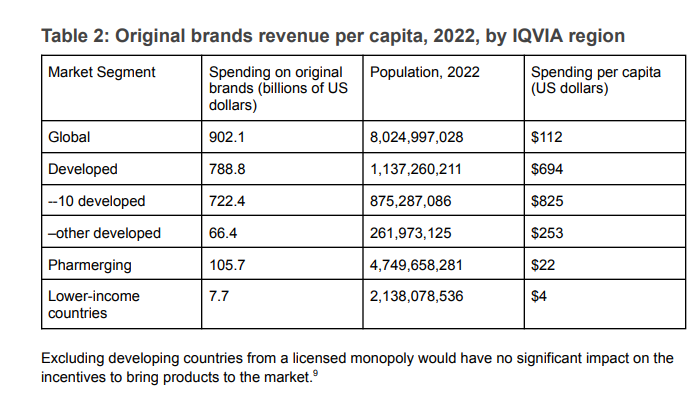
The differences in spending on original brand name products provide an even starker picture of access. While we don’t know the price differences that will explain some of the disparities in terms of access, what jumps out is the difference between the $825 per capita for the 10 developed countries and the $4 per capita for the 2.14 billion people living in countries that IQVIA classifies as lower income or the $22 per capita for the IQVIA region referred to as Pharmerging (see Table 2).
Table 2: Original brands revenue per capita, 2022, by IQVIA region
Company Reports
Company disclosures of sales revenue by geographic area are highly aggregated. For example, companies, like BMS, J&J, Iovance, or Amgen typically report revenues in two segments, the USA and the rest of the world, lumping all non-US high-income countries together with all middle- and low-income countries. Some companies typically report revenues into three geographic segments, the USA, Europe, and the rest of the world. There are some exceptions where more detailed data is available. In most cases, the revenues are highly concentrated in the United States and other developed countries. These are a few examples of how companies report sales in annual reports to shareholders.
Gilead
Gilead normally reports sales in three geographic segments, the US, Europe, and the rest of the world. Yescarta is a CAR T treatment licensed by the NIH. In 2023, the most recent SEC 10-K filing, 90.7 percent of sales were from the United States and Europe, leaving 9.3 percent for the rest of the world, including other high-income countries and all developing countries.
AbbVie
AbbVie reports sales for all products by eleven countries and the rest of the world. 77 percent of sales are in the United States. Brazil, the only developing country listed separately, is a country of 215 million persons and represents 0.8 percent of sales. The rest of the world category represents 9.3 percent of sales and includes several high-income countries.
Eli Lilly
Eli Lilly reports sales for all products in five geographic segments, the United States, Europe, Japan, China and the rest of the world. The United States, Europe and Japan account for 87 percent of sales, China 4.5 percent, and 8.6 percent for the rest of the world, including other high-income countries.
Merck
Merck reports sales of all products by nine geographic regions. The combined sales for all of Latin America, Asia Pacific (other than China and Japan) and Eastern Europe, the Middle East and Africa is 11.2 percent.
Biogen
Biogen reports income separately for three types of income, (1) revenue from external customers, (2) the anti-CD20 therapeutic programs, and (3) contract manufacturing, royalty and other revenue, and for five geographic segments: the U.S., Europe except Germany, Germany, Asia, and other. 85 percent of the product revenues and 96 percent of the revenues from the anti-CD20 therapeutic programs are from the U.S. and Europe.
Additional Tables
Table 3: Gilead sales by region for cell therapies and other oncology products, in millions of U.S. dollars
Table 4: AbbVie net revenues to external customers by geographic area, based on product shipment destination, in millions of U.S. dollars
Table 5: Eli Lilly sales by geographic segment, in millions of U.S. dollars
Table 6: Merck sales by geographic region through Q2 of 2024, in millions of U.S. dollars.
Table 7: Biogen, revenue by geographic region, year ending December 31, 2023, in millions of U.S. dollars
Footnotes:
[1] Quoting the 01/11/2024 version. https://www.techtransfer.nih.gov/sites/default/files/documents/policy/pdfs/Chapter%20300%20-%20PHS%20Licensing%20Policy.pdf
[2] https://www.who.int/publications/m/item/wha72.8
[3] This can be compared to the 1980 version of the Act, which read: “(1) periodic reporting on the utilization or efforts at obtaining utilization that are being made by the licensee with particular reference to the plan submitted: Provided, That any such information may be treated by the Federal agency 83 commercial and financial information obtained from a person and privileged and confidential and not subject to disclosure under section 552 of title 5 of the United States Code;”
[4] Particularly the geographic scope, the term of rights, and technology transfer obligations.
[5] Based upon the World Bank estimates of GNI per capita, using the Atlas method.
[6] See: KEI Submissions to the NIH on the Draft NIH Intramural Research Program Policy: Promoting Equity Through Access Planning, July 23, 2024. https://www.keionline.org/40130
[7] Access to rights in patented inventions, the rights to use data submitted to regulatory agencies, access to manufacturing know-how and biologic resources, and any other ancillary measures necessary to make, register and market generic products.
[8] IQVIA. The Global Use of Medicines 2023: Outlook to 2027, Page 52. https://www.iqvia.com/-/media/iqvia/pdfs/institute-reports/the-global-use-of-medicines-2023/iqvia-institute-global-use-of-medicines-2023-report-01-23-forweb.pdf
[9] The Global Use of Medicines 2023: Outlook to 2027, Exhibit 30: Global medicine spending and growth by product type, Page 36. https://www.iqvia.com/-/media/iqvia/pdfs/institute-reports/the-global-use-of-medicines-2023/iqvia-institute-global-use-of-medicines-2023-report-01-23-forweb.pdf